Building a Dashboard
You can create personalized dashboards in CloudAgent using flexible widgets that help monitor key performance indicators in real time.
Steps to Create a Dashboard
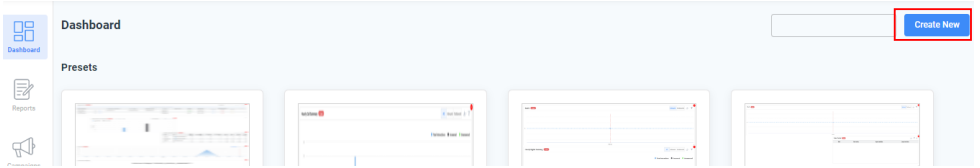
- From the Dashboard home screen, click Create New (top-right corner).
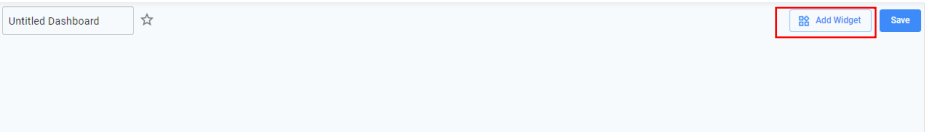
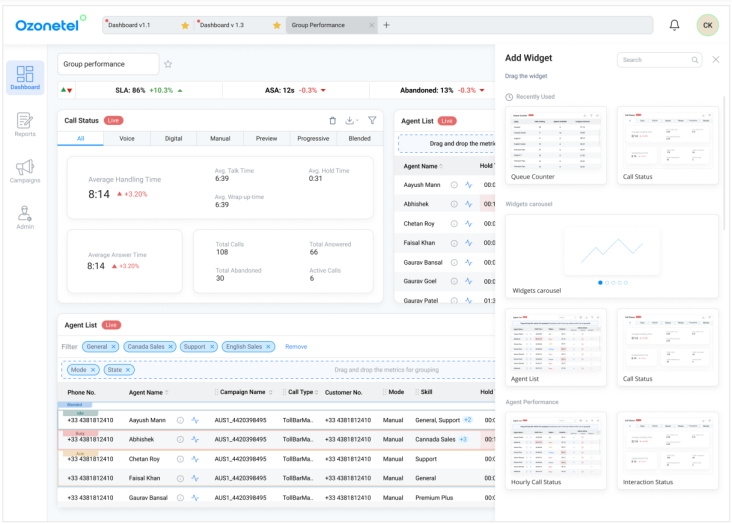
- Click Add Widget to open the widget panel on the right.
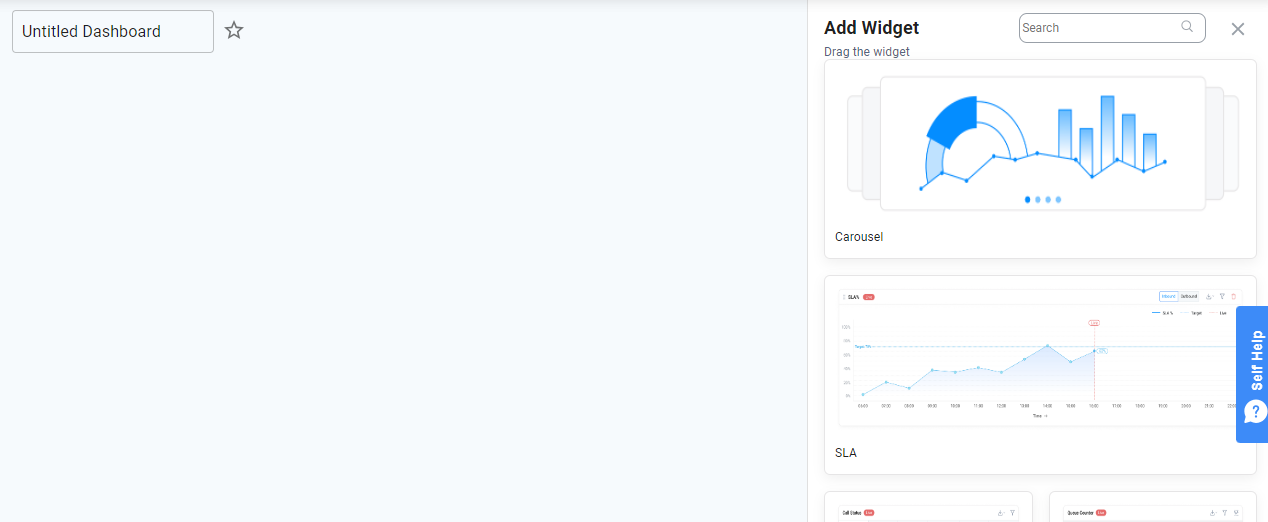
- Click on the "Add Widget" button to display the list of available widgets on the right side of the screen.
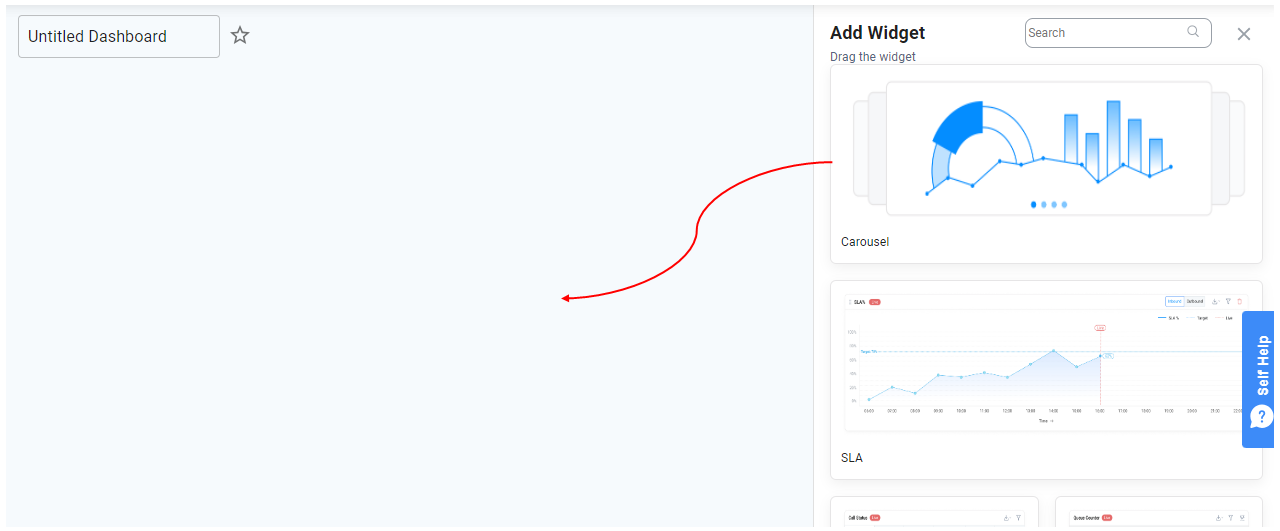
- Drag and drop the widgets you want onto your dashboard.
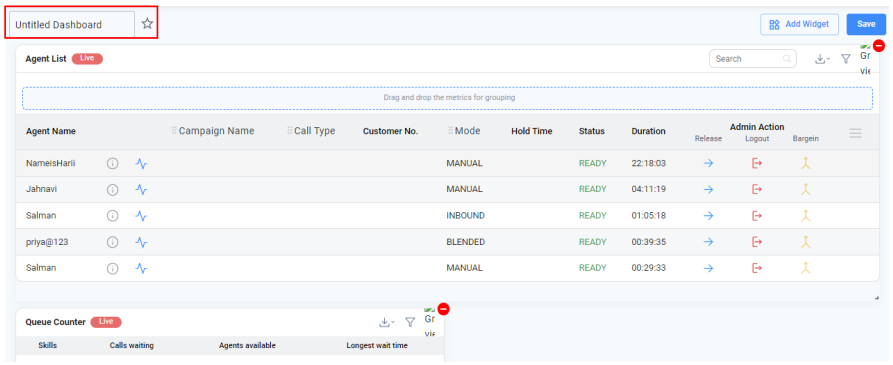
- Rearrange widgets by dragging them into your preferred order. Below is an example of Call Status and Agent List added to the Dashboard. You have the feasibility of adjusting the widget order.
- Name your dashboard and click Save.
- To pin a dashboard to the top of your list, click the star icon beside its name.
NoteFilters applied to individual widgets will be saved along with the dashboard. These filters will persist until manually updated and saved again.
Dashboard Components
CloudAgent dashboards are divided into four main sections to suit different user roles and needs:
Preset: These are ready-to-use system templates that act as starting points. You can modify or build on them to suit your requirements.
Wallboard Designed for real-time display screens, the Wallboard includes fixed widgets that can be customized by removing those not needed. It tracks key metrics like SLA, ASA, and Skill Queue trends to assess operational performance over time.
My Favorites: A quick-access section that stores dashboards marked as favorites, so your most-used views are always easy to find.
My Dashboard: This section lists all your custom dashboards created with widgets like Agent Performance, Agent State Counter, and Hourly Call Summary. It gives full flexibility to design layouts that match your reporting needs.
Need Help?Watch these videos to easily replicate your existing CCaaS dashboards in the new CxHub interface. Click here to get started
Updated about 1 year ago